
The Relative Strength Index (RSI), introduced by J. Welles Wilder Jr., is one of the most widely recognized momentum oscillators in technical analysis. It evaluates the speed and magnitude of price changes to determine whether a market is in an overbought or oversold condition. RSI remains popular because it not only highlights potential reversal zones but also provides insight into the strength of ongoing trends.
Interpolation enhancements further refine the indicator by reducing sudden spikes and smoothing transitions, making RSI signals more stable and easier to interpret.
Structural Components
The RSI calculation is based on average gains and losses over a chosen period:
[ RSI = 100 – {100}/{1 + RS} ]
Where:
- RS (Relative Strength): Ratio of average gains to average losses.
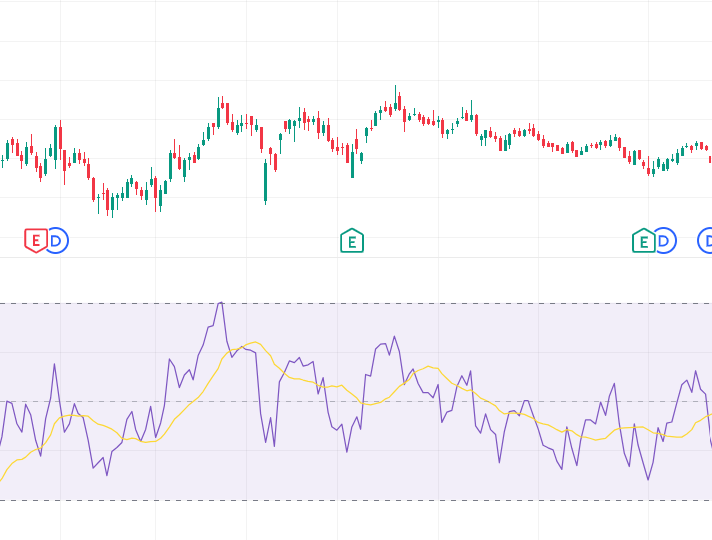
- Oscillation Range: Values move between 0 and 100.
- Thresholds: Readings above 70 typically suggest overbought conditions, while values below 30 indicate oversold zones.
- Interpolation Smoothing: Applied to reduce erratic movements and improve reliability.
Distinctive Attributes
- Overbought/Oversold Detection: Identifies exhaustion zones where reversals may occur.
- Divergence Signals: Highlights weakening trends when price and RSI move in opposite directions.
- Trend Strength Analysis: Confirms whether momentum supports continuation.
- Swing Rejection Patterns: Advanced formations that provide deeper momentum insight.
- Noise Filtering: Interpolation reduces false triggers caused by volatility spikes.
- Multi‑Timeframe Utility: Effective across intraday, swing, and long‑term analysis.
Market Psychology Reflected
- High RSI Readings (Above 70): Suggest excessive optimism and potential overextension.
- Low RSI Readings (Below 30): Reflect pessimism and possible rebound zones.
- Centerline Crossovers (Near 50): Indicate shifts in crowd sentiment, marking transitions between bullish and bearish phases.
- Divergence Patterns: Reveal hesitation when price continues in one direction but RSI fails to confirm.
This dynamic captures how traders collectively respond to market extremes, offering a lens into crowd behavior.
Analytical Considerations
- RSI is momentum‑sensitive, making it effective in both trending and range‑bound markets.
- It is often paired with moving averages, MACD, or Bollinger Bands to confirm signals.
- Particularly useful for systematic models and discretionary traders, where precision and stability are critical.
- Customizable parameters (commonly 14 periods) allow adaptation to different assets and trading styles.
Contextual Importance
- Momentum Confirmation: Validates whether price action supports bullish or bearish sentiment.
- Reversal Alerts: Detects weakening momentum before price shifts occur.
- Noise Filtering: Provides smoother signals that reduce false entries.
- Decision Support: Enhances confidence by offering clearer visualization of market direction.
Final Insight
The Relative Strength Index (RSI) remains one of the most effective and versatile momentum indicators in technical analysis. Its ability to highlight overbought and oversold conditions, confirm trend strength, and detect divergences makes it indispensable across all markets. With interpolation smoothing reducing noise and false signals, RSI becomes even more reliable, offering traders a structured framework to interpret momentum shifts and improve decision‑making accuracy.